Skip to content
Forest Ecology and Conservation Group
Changing the Landscape of Conservation
Home
About Us
Work with us
Group
Group Overview
Current Members
Former Members
Photo Gallery
Cambridge
Lab Retreats
Dining Together
Punting
Research
Current Projects
Publications
Recent Publications
Resources
Contact us
Yi Zhang
Forest dynamics where typhoon winds blow
December 14, 2024
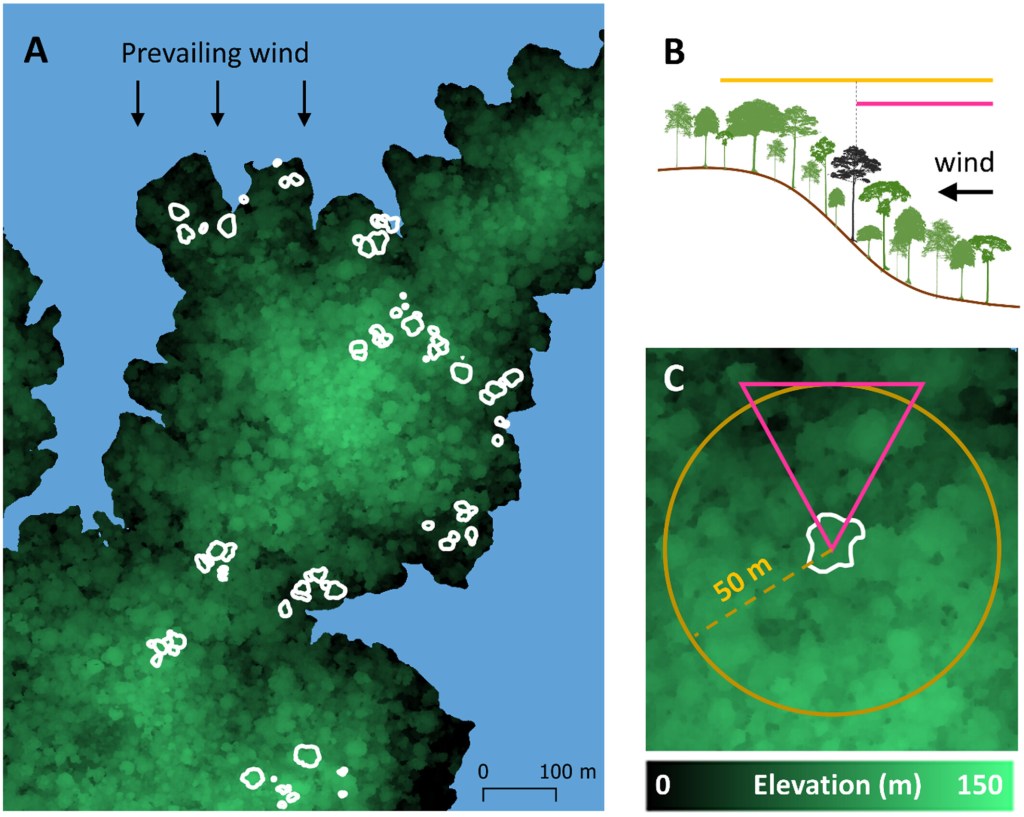
Wind Shapes the Growth Strategies of Trees in a Tropical Forest
October 2, 2024
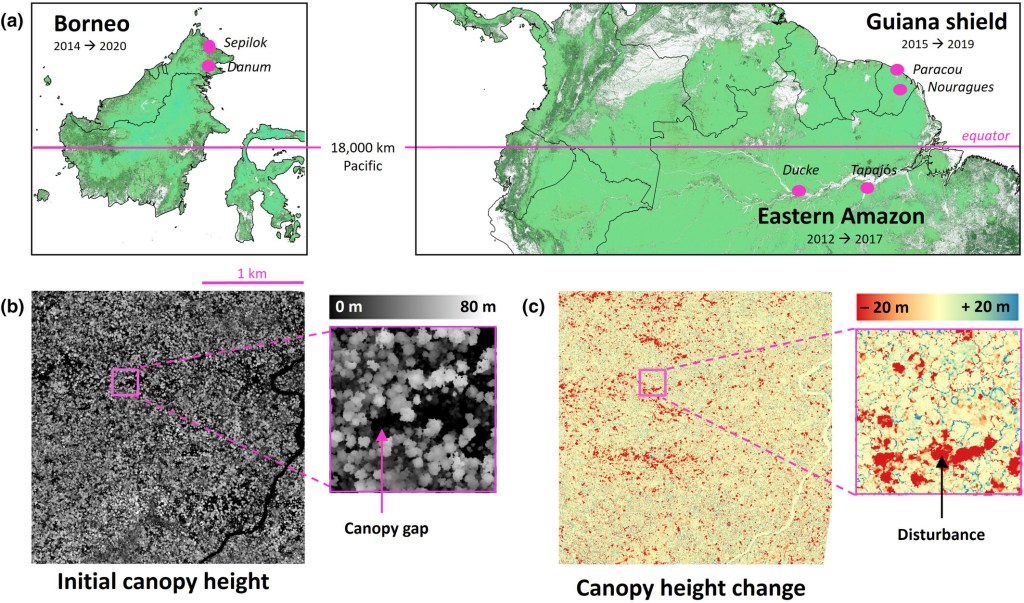
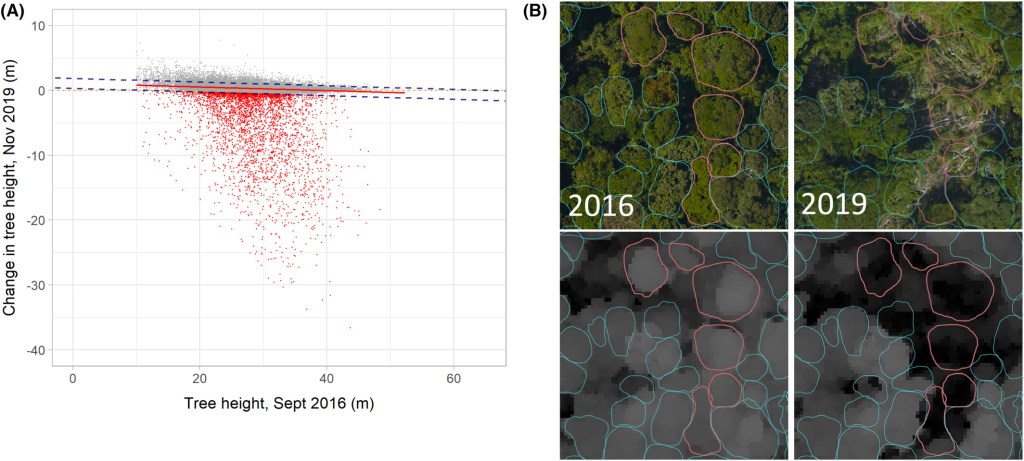
Tall Bornean forests experience higher canopy disturbance rates than those in the eastern Amazon or Guiana shield
September 6, 2024
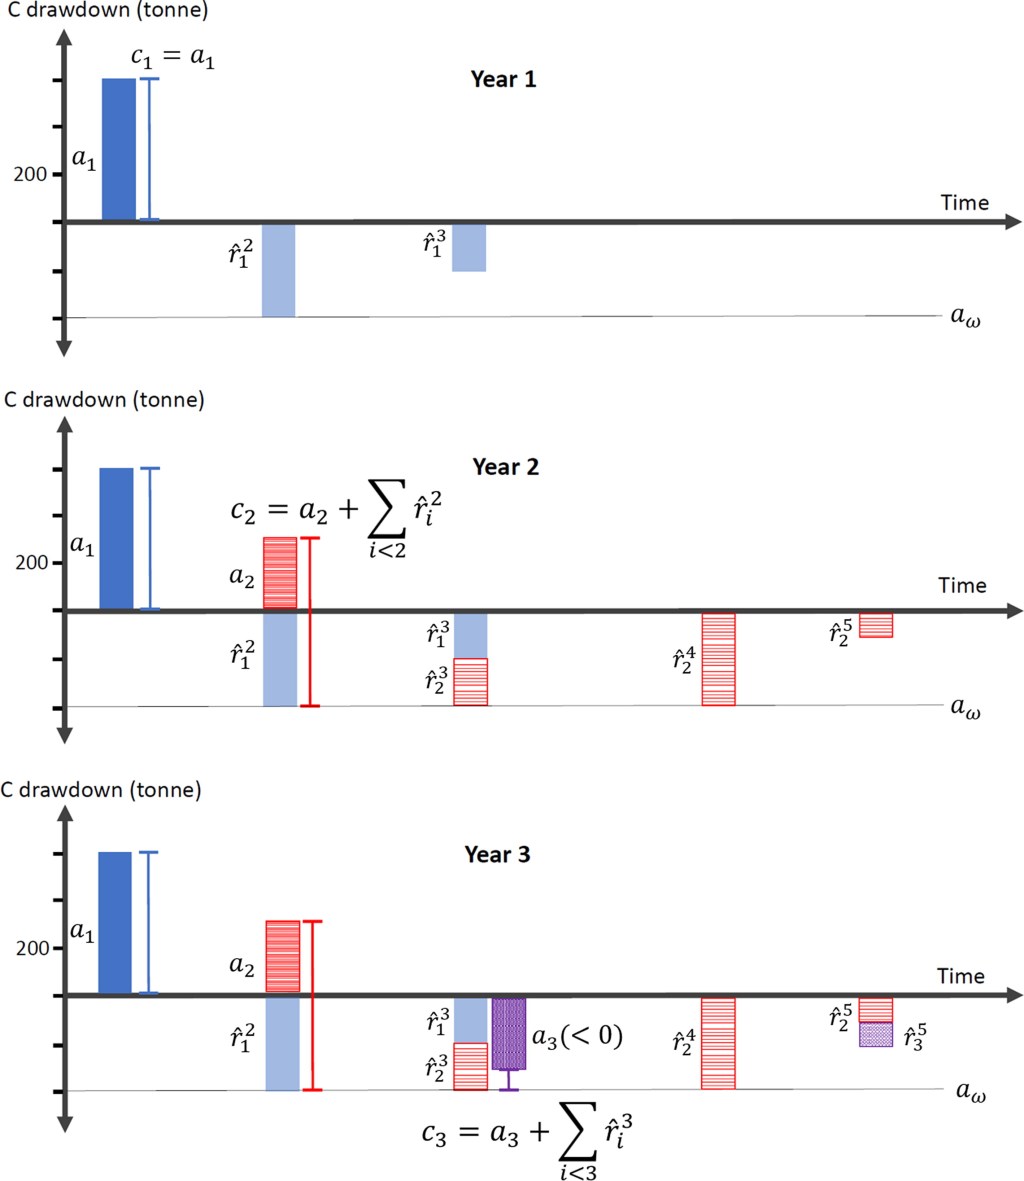
Mitigating risk of credit reversal in nature-based climate solutions by optimally anticipating carbon release
August 31, 2024
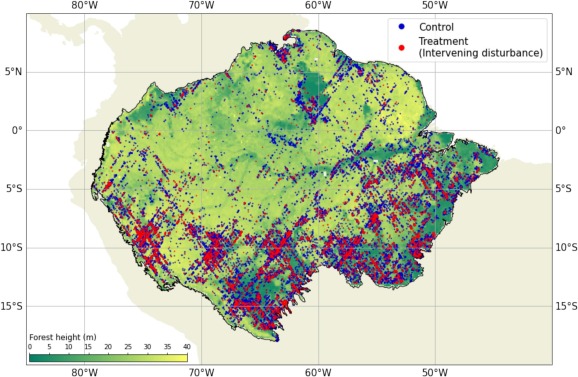
Repeat GEDI footprints measure the effects of tropical forest disturbances
July 1, 2024
Consistent patterns of common species across tropical tree communities
January 16, 2024
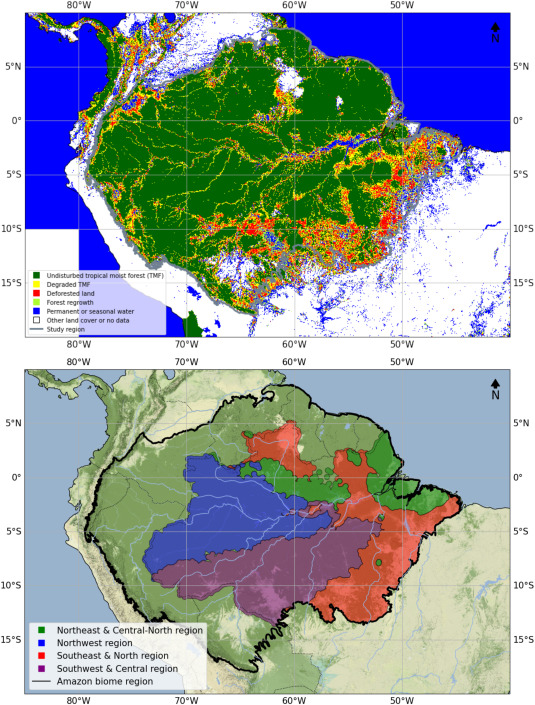
Computational tools for assessing forest recovery with GEDI shots and forest change maps
November 7, 2023
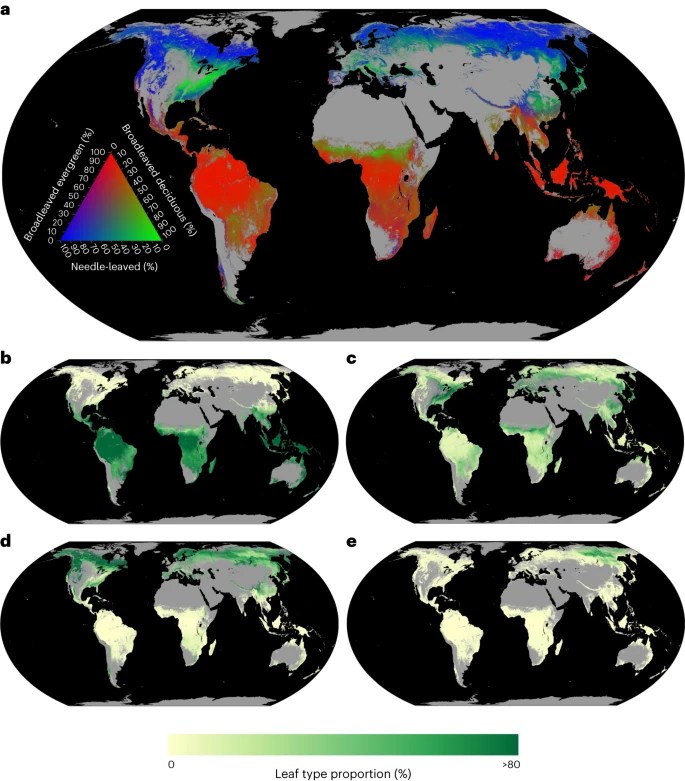
The global biogeography of tree leaf form and habit
October 23, 2023
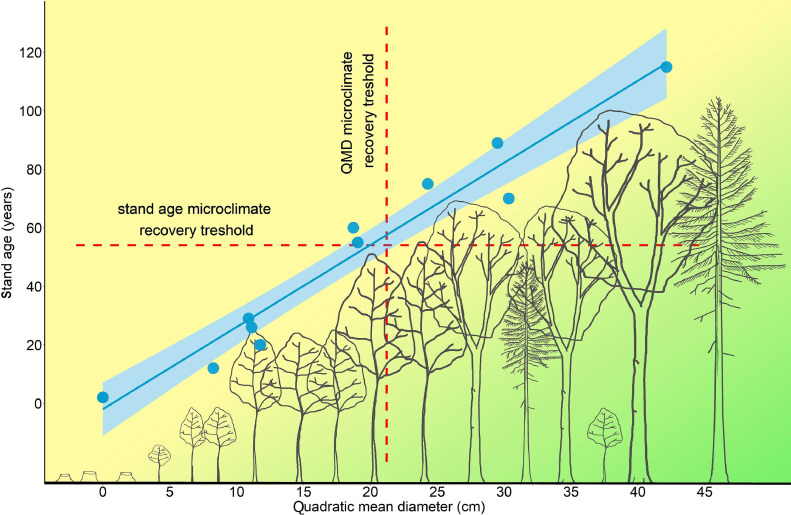
Microclimate variation and recovery time in managed and old-growth temperate forests
September 29, 2023
Accurate delineation of individual tree crowns in tropical forests from aerial RGB imagery using Mask R-CNN
May 13, 2023
Subscribe
Subscribed
Forest Ecology and Conservation Group
Sign me up
Already have a WordPress.com account?
Log in now.
Forest Ecology and Conservation Group
Subscribe
Subscribed
Sign up
Log in
Report this content
View site in Reader
Manage subscriptions
Collapse this bar